English
 Arabic
 French
 Spanish
 Portuguese
 Deutsch
 Turkish
 Dutch
Dutch
 Italiano
 Russian
 Romaian
 Portuguese (Brazil)
 Greek
Greek
The High-Temperature Silicone Seals Standard: How Advanced Thermal Sealing and Custom Inflatable Silicone Gaskets Are Shaping Extreme Environment Applications
Other |
2026-07-15 06:04:53
Ever wonder why some brands seem to know exactly what you want before you do? That's not luck. It's consumer insights at work.
74% of consumers say they choose where to buy based on experience rather than price. That means most businesses are losing sales not because their product is wrong or their price is off — but because they don't know enough about the people buying from them.
Consumer insights are findings businesses gather about why customers buy, what stops them from buying, and what keeps them coming back. The data comes from purchase histories, cart behavior, reviews, loyalty programs, and direct customer feedback. When companies take that information seriously, it shows up in revenue — better conversion rates, fewer abandoned carts, higher average order values, and stronger repeat business.
This article covers:
Where this data comes from, how personalization lifts conversions,
What's causing cart abandonment (and how to fix it),
Why reviews matter more than most businesses assume, and
Where your conversion rate should sit against your industry.
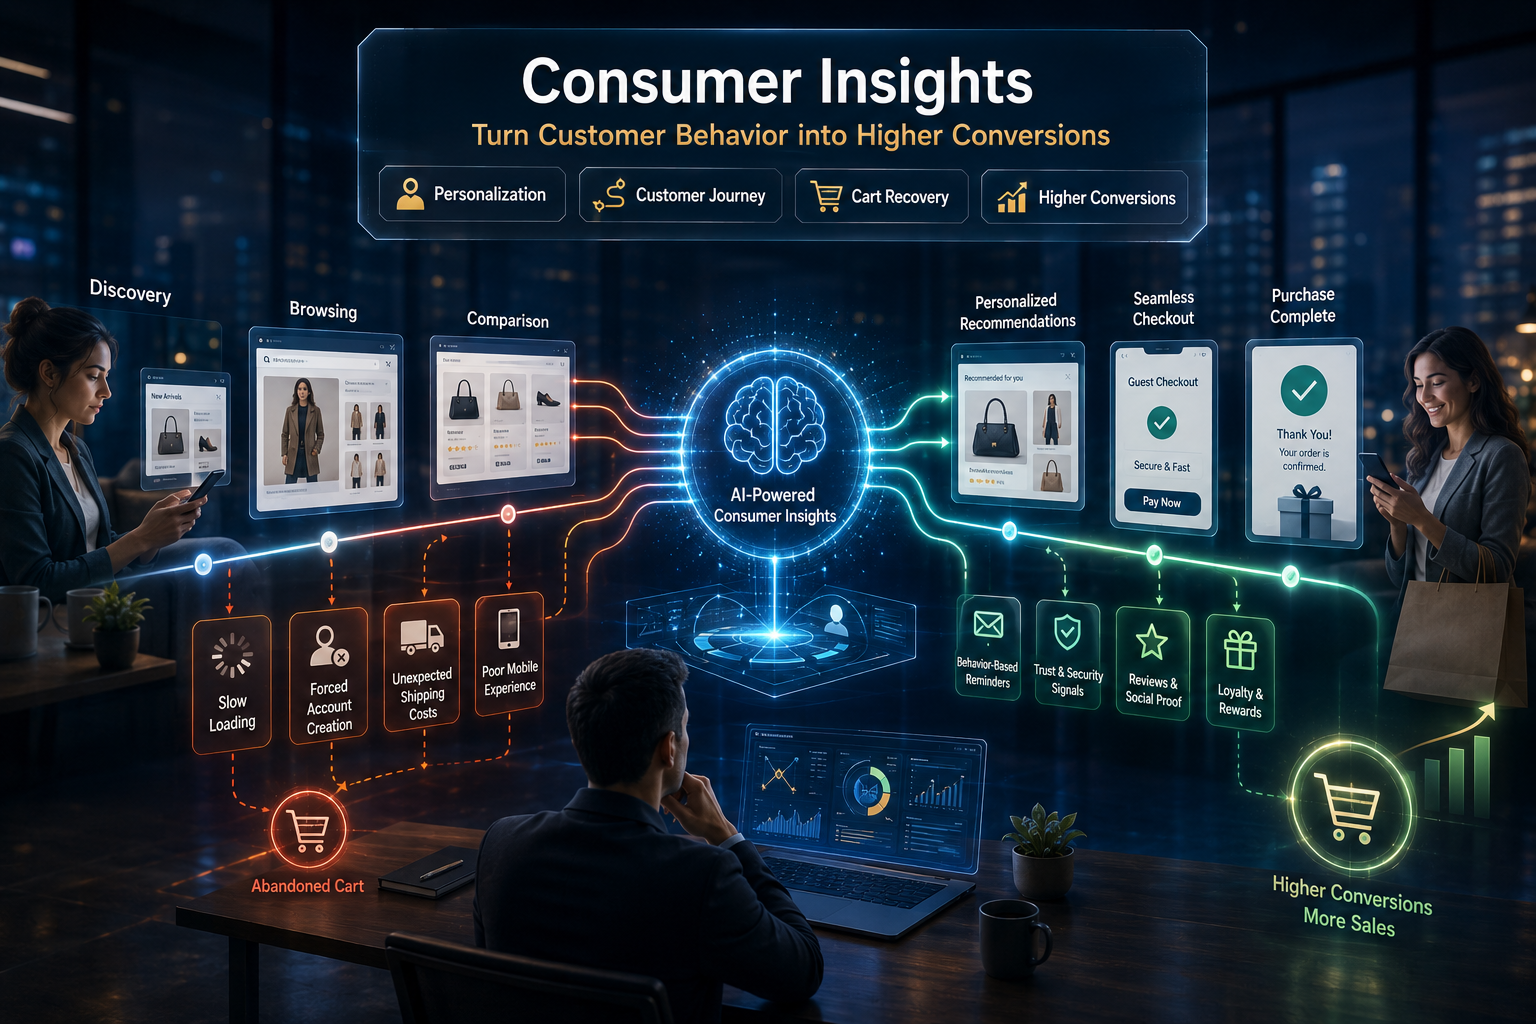
Raw data and consumer insight are not the same thing. Data tells you what happened. Insight tells you why.
500 people abandoned their cart on Tuesday — that's data. They abandoned it because your checkout forced them to create an account and they weren't willing to — that's insight. One of these tells you something is wrong. The other tells you how to fix it.
According to Circana's 2026 consumer marketing analysis, brands that pool data from shopper panels, loyalty programs, and transaction history develop the most complete picture of how consumers actually shop — not just how they browse. The distinction matters because purchase decisions happen in very specific moments, and those moments are almost always triggered by something a surface-level report won't show.
74% of consumers prioritize experience over price (Small Business Trends, 2026) 70% of online shopping carts are abandoned globally (SQ Magazine, 2026) 85% mobile cart abandonment rate — highest of any device 29% conversion rate increase from user-generated content 270% more likely to purchase a product that has at least 5 reviews vs. none 2.8% average email conversion rate for B2C brands (FirstPageSage, 2025)
No single source tells the full story. A business that only checks purchase history misses the people who almost bought and didn't. One that only reads reviews misses the quiet majority who never write one.
|
Data Source |
What It Tells a Business |
|
Purchase history |
What customers buy, how often, and at what spend level |
|
website heatmaps & sessions recordings |
Where users click, hesitate, scroll, and leave |
|
Cart behavior data |
At which step buyers drop off and why |
|
Loyalty program data |
Which rewards actually drive repeat purchases |
|
Post-purchase surveys |
How customers felt during and after the buying experience |
|
Social media listening |
What customers say about the brand when no one is asking |
|
Customer service transcripts |
Recurring pain points and unmet expectations |
|
Third-party shopper panels |
How behavior compares across a full market, not just your store |
Personalization delivers the highest return of anything on this list, and the gap between businesses doing it well and those winging it is clear in the numbers.
Email marketing converts at 2.8% for B2C brands and 2.4% for B2B, per FirstPageSage — the highest-converting channel out there, but only when it's segmented by actual behavior instead of blasted to everyone at once.
User-generated content bumps conversions by up to 29%. People trust other buyers more than they trust brand copy, plain and simple.
|
Brands |
What They Did |
Result |
|
PUMA |
Gamified engagement using behavioral data |
231% lift in the lead submissions |
|
Lenovo |
Real-time campaigns built on shopper signals |
Stronger cross-sell conversions |
|
Enklare |
Predictive segments based on intent data |
Lower acquisition cost, better leads |
(Source: Insider One customer engagement report, March 2026)
Roughly 70% of carts get abandoned — 85% on mobile. These aren't people who never wanted to buy. They wanted to, and something got in the way.
|
What's Causing It |
The Fix |
|
Forced account creation |
Add guest checkout (60%+ of shoppers prefer it) |
|
Shipping cost shown too late |
Show total cost early |
|
Too few payment options |
Add wallets, BNPL, Local methods |
|
Slow page loads |
Under 2 seconds convert 3x better than 5 |
|
Too many checkout steps |
Cut from fields, offer one-click checkout |
|
No trust signals at payments |
Security badges, return policy, reviews |
Landing pages with fewer than 10 elements convert roughly twice as well as pages stuffed with 40+. The instinct to add more almost always backfires.
A product with just five reviews is 270% more likely to sell than one with none. Not five hundred — five. That threshold is a lot lower than most businesses assume.
It scales with price too: reviews lift conversions to 190% on cheaper items and up to 380% on expensive ones, so higher-ticket sellers have the most to gain from an active review strategy.
One odd finding — a perfect 5.0 rating can actually hurt trust; shoppers get suspicious. Products between 4.0 and 4.7 stars tend to convert best, and visual UGC (real photos, real videos) nearly doubles conversion, from 3.4% up to 6.6%.
A 2% conversion rate means something totally different in luxury goods than it does in grocery.
|
Industry |
Average Conversion Rate |
|
Food and Beverage |
6.02% |
|
Health and Beauty |
around 3.5% |
|
Fashion and Apparel |
around 2.0-2.5% |
|
Electronics |
around 1.5-2.0% |
|
Luxury Goods |
Below 1% |
(Source: Nector.io, May 2026)
Desktop still edges out mobile too — about 4.8% versus 2.9% — even though mobile drives over 60% of all e-commerce traffic. Closing that gap is one of the better investments most businesses can make right now.
What are consumer insights, in plain terms?
The reasons behind customer behavior — why people buy, why they don't, what pushes them away. Not just the behavior, but the "why" underneath it.
What's a good conversion rate in 2026?
Depends on your industry. Food and beverage sits around 6%. Fashion is closer to 2%. Compare against your category, not a general average.
How does this actually increase sales?
It shows exactly where people drop off and which offers convert with which audience. Fixing those spots with real data, instead of guessing, moves conversion rates up directly.
What tools do businesses use for this?
Google Analytics, Hotjar, CRM platforms, survey tools, and social listening tools are common. No single tool covers everything — combining sources gets the full picture.
Does personalization really work?
Consistently. Behavior-segmented emails convert far better than generic blasts, and personalized recommendations show measurable lifts when built on real customer data.
Why do people abandon carts even when they want to buy?
Usually forced account creation, late shipping costs, or too few payment options. These are checkout design problems, not marketing ones, and insight data is what surfaces them.